Have complete confidence in
your data
Goodbye silos. Hello connectivity. Today’s digital+ economy demands data everyone can easily access, share, and trust with 100% confidence.
Actian enables confident, data-driven organizations
We allow our customers to make confident, data-driven decisions that accelerate their organization’s growth.

Data analytics
In the realm of data analytics, the Actian Data Platform stands as a beacon of confidence, offering robust tools and capabilities to empower informed decision-making.
The Actian Data Platform works with all your analytical applications to support the needs of users with a wide range of technical skills.
Learn moreDiscover how easy business users can access the latest data for fast analytics across your data centers and clouds. Realize superior performance as you run complex queries against billions of records on commodity hardware in seconds.
Learn more
Transform faster using the world’s most trusted transactional database that has been delivering ground-breaking insights for decades—it was in the room when data happened. It has run billions of OLTP operations for thousands of enterprises, and it can help you too.
Learn moreTrust the Zen family of databases—Zen Core, Zen Edge, Zen Enterprise, and Zen Cloud Server—for a small footprint, low maintenance, high-performance database management system. The databases are ideal for apps running in branch offices or on Edge devices.
Learn moreMake application development fast and easy with our NoSQL Object Database. Benefit from agile development, high availability, synchronous and asynchronous replication, and more. Software developers can simplify handling database requirements for complex object models.
Learn moreMake OneDB your enterprise-grade database of choice for a cloud-native deployment. It gives you a fast, affordable path to the cloud with minimal risk. You gain versatility, reliability, and ease of use to address data management and application development challenges.
Learn moreTap into the speed, reliability, and security you need in a database, along with cost-optimized high performance across thousands of users. Scale to meet your business needs with zero downtime while using embedded data management capabilities.
Learn moreBenefit from a single offering that brings together the Ingres Transactional Database and the Vector Analytics Database for OLTP and next-generation operational analytics. Leading organizations run their business-critical systems on Actian X—and you can too.
Learn more
Data integration & quality
Accelerate your growth by simplifying how you connect, manage, and analyze data. Take advantage of Actian’s industry-leading price performance and flexible deployment options to make confident, data-driven decisions faster.
Use this fully managed B2B integration as a service offering to integrate and connect with any trading partner, regardless of data requirements or back-office systems. It makes electronic document exchanges easy while helping partners reduce costs and improve efficiencies.
Learn moreFind out how a parallel execution platform for real-time processing and analysis of data-in-motion can advance your business. Actian DataFlow enables easy-to-use, high-performance data extraction, analysis, transformation, and loading.
Learn moreDeliver high-quality data at the speed of business by unifying, transforming, and orchestrating data pipelines. Use this intelligent, low-code integration platform to address your most complex use cases with automated, intuitive, and reusable integrations.
Learn moreAccelerate your growth by simplifying how you connect, manage, and analyze data. Take advantage of Actian’s industry-leading price performance and flexible deployment options to make confident, data-driven decisions faster.
Learn more
Application services
Take a modern approach to developing applications that are scalable, secure, and easy to maintain.
Provide a modern, dedicated development experience for citizen developers to build apps by using Volt MX. Support your developers as they work collaboratively with IT and have IT governance.
Learn moreUplevel your approach to database application development. Experience faster development, more versatile client support, and quicker deployment. OpenROAD gives you the ability to develop and deploy mission-critical, n-tier business applications on a variety of platforms.
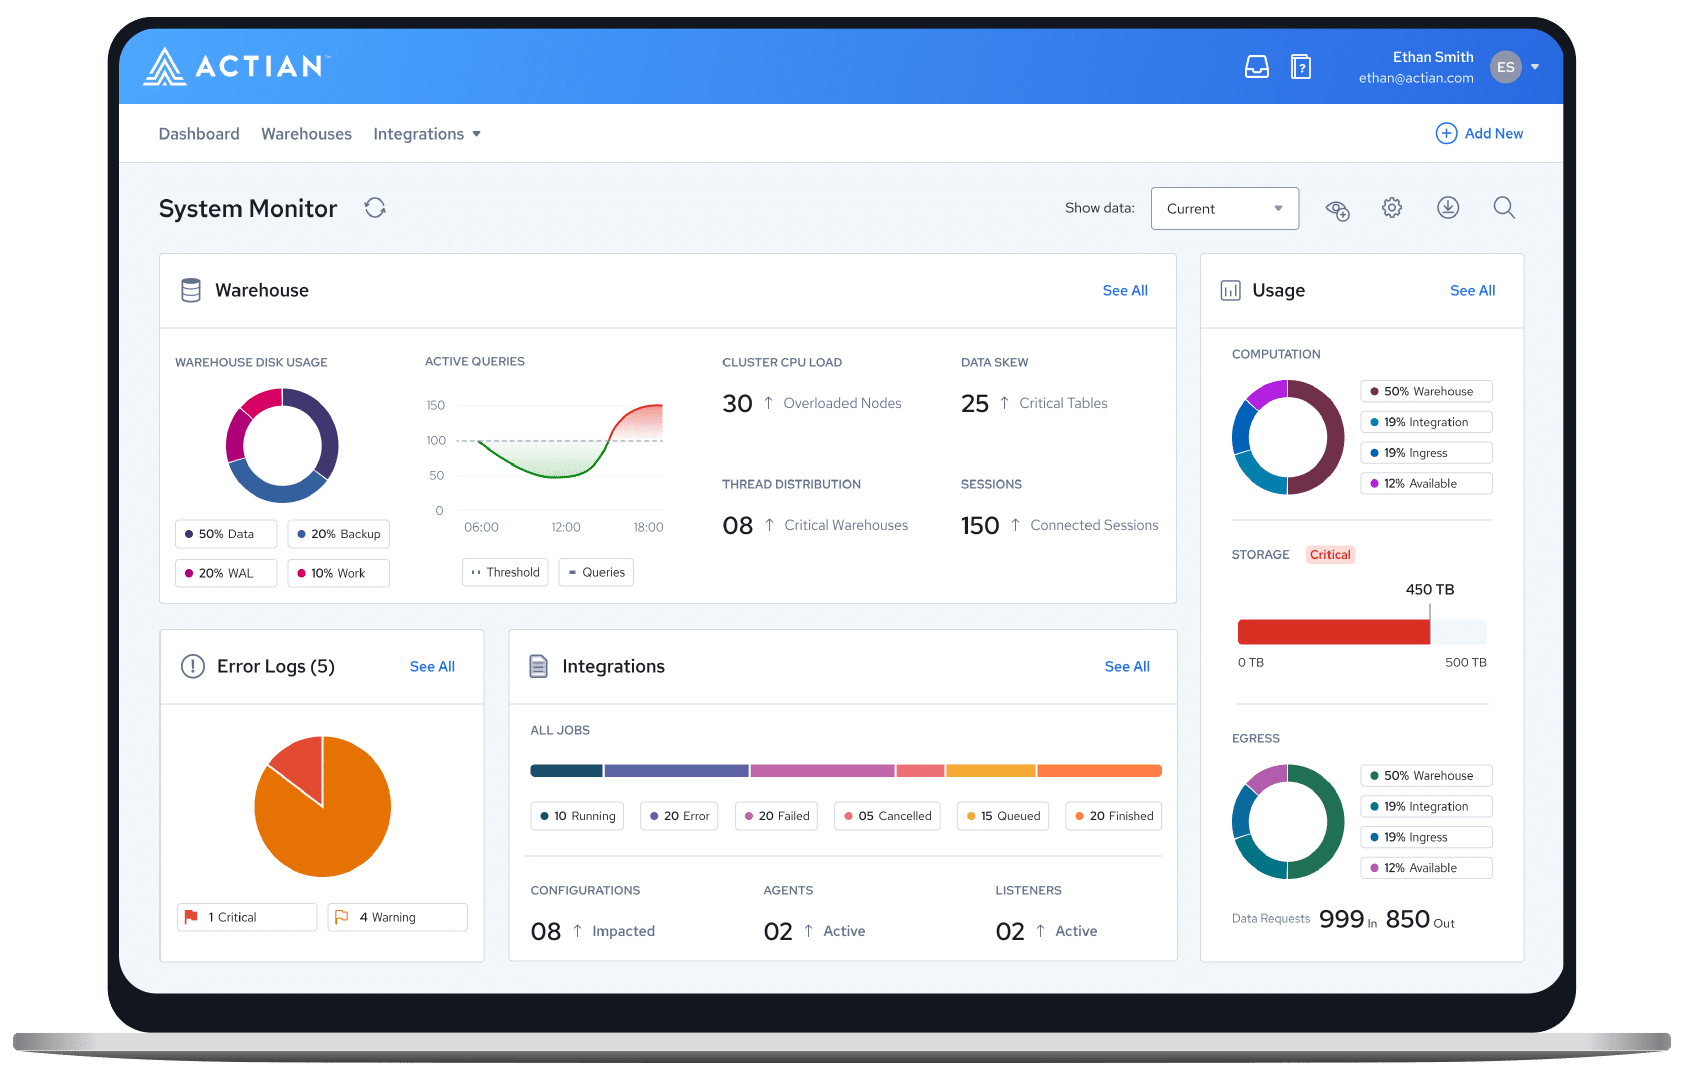
Learn moreData and analytics made easy
Our advanced data platform simplifies your business by making it easy to connect, manage, and analyze your data.


Data-driven confidence.
Industry-leading versatility.
Accelerate your business with confidence: Actian provides a highly adaptable, unified experience for ingesting, transforming, and analyzing data – all with unrivaled performance, speed, and scalability.

"Actian is a critical part of our infrastructure. Without it, we couldn’t do the processing and automation needed for our banking operations."
"Actian's expert customer service has been invaluable on our journey, as their team not only understands our specific requirements and delivers tailored and responsive solutions, contributing significantly to our success."

Experience an easy-to-use and 'innovative' platform
Independent research is important when evaluating platforms. Find out how we stack up against the competition in the Ventana Research’s 2023 Data Platform Value Index.
Proven performance. Unbeatable value.
Users
Empowering over 42 million users worldwide.
Customers
Over 10,000 businesses trust Actian for scalable cloud technologies.
of the Fortune 100
Fortune 100 leaders in finance, retail, telecom, and more rely on Actian.
A modern approach to data for modern businesses
More than 10,000 customers trust us with their data. With Actian, you have the flexibility to deploy workloads anywhere—cloud, on-premises, or hybrid environments. Data that’s easy to use for everyone empowers your business to become truly data-driven.
Reliable delivery
Use our products for constant, reliable performance while ensuring minimal disruption. Our 50 years of experience—we were in the room when data happened—gives us an expert understanding of your needs. You can trust our products and services.
Modern integration
Leverage holistic platform data integration, management, and analytics capabilities as part of an easy-to-use experience. Optimize the Actian Data Platform platform by integrating it with all of your systems for maximum interoperability.
Committed partnership
Benefit from always-available support to proactively detect and solve potential issues. We treat each case as a high priority and are committed to your success—wherever you’re at on your data journey.
Scalable speed
Have confidence that we will meet your growth ambitions by scaling right alongside you. Our flexible, comprehensive platform structure and our ongoing partnership model make scaling fast, efficient, and effective.